
 ‘Fedspeak’ moves markets
By Anne D. Picker, Chief Economist, Econoday
Friday, November 30, 2007

November ended on a positive note thanks to Fedspeak by the chairman, vice chairman and a Federal Reserve governor last week. The rally in equities ameliorated what otherwise would have been even larger losses in November. After Wednesday’s speech by Fed Vice Chairman Donald Kohn, financial stocks soared as market players expressed new optimism that the Federal Reserve would ride to their rescue and the credit squeeze would be a thing of the past. While Kohn said that he disliked creating “moral hazard,” he also thought that when things go badly, innocent bystanders should not have to bear the costs. He also said that the Fed would be “flexible and pragmatic” in responding to new risks to economic growth that could arise from financial market woes. This was interpreted by equity investors to mean that a rate cut was on the way. Equities around the world celebrated. Despite this end of month enthusiasm, it was too late to save the indexes followed here from most of the month’s losses. The better news was that all were up on the week. Only the Japanese indexes remain down for 2007.
|
|
2006 |
2007 |
% Change |
|
Index |
Dec 29 |
Nov 23 |
Nov 30 |
Week |
Month |
Year |
| Asia |
|
|
|
|
|
|
|
| Australia |
All Ordinaries |
5644.3 |
6392.4 |
6593.6 |
3.15% |
-2.74% |
16.82% |
| Japan |
Nikkei 225 |
17225.8 |
14888.8 |
15680.7 |
5.32% |
-6.31% |
-8.97% |
|
Topix |
1681.1 |
1437.4 |
1531.9 |
6.57% |
-5.44% |
-8.87% |
| Hong Kong |
Hang Seng |
19964.7 |
26541.1 |
28643.6 |
7.92% |
-8.64% |
43.47% |
| S. Korea |
Kospi |
1434.5 |
1772.9 |
1906.0 |
7.51% |
-7.69% |
32.87% |
| Singapore |
STI |
2985.8 |
3325.9 |
3521.3 |
5.87% |
-7.47% |
17.93% |
|
|
|
|
|
|
|
|
| Europe |
|
|
|
|
|
|
|
| UK |
FTSE 100 |
6220.8 |
6262.1 |
6432.5 |
2.72% |
-4.30% |
3.40% |
| France |
CAC |
5541.8 |
5521.2 |
5670.6 |
2.71% |
-3.03% |
2.32% |
| Germany |
XETRA DAX |
6596.9 |
7609.0 |
7870.5 |
3.44% |
-1.85% |
19.31% |
|
|
|
|
|
|
|
|
| North America |
|
|
|
|
|
|
|
| United States |
Dow |
12463.2 |
12980.9 |
13371.7 |
3.01% |
-4.01% |
7.29% |
|
NASDAQ |
2415.3 |
2596.6 |
2661.0 |
2.48% |
-6.93% |
10.17% |
|
S&P 500 |
1418.3 |
1440.7 |
1481.1 |
2.80% |
-4.41% |
4.43% |
| Canada |
S&P/TSX Comp. |
12908.4 |
13467.2 |
13720.7 |
1.88% |
-6.18% |
6.29% |
| Mexico |
Bolsa |
26448.3 |
28710.9 |
29793.7 |
3.77% |
-5.29% |
12.65% |
After declining the first two days of the week, stocks rallied as hopes for a U.S. interest rate cut underpinned the biggest one-day gain in European shares for more than four years. Stocks here followed those in the U.S. after Fed Vice Chairman Kohn said market “turbulence’’ could crimp credit to businesses and consumers. (Investors ignored disappointing U.S. economic data on housing and durable goods orders.) His comments softened the Federal Reserve’s previous stance on rates and invigorated investors on the other side of the Atlantic. Banks and other financial stocks staged a strong rally. The party continued to roll on Thursday after the dollar increased in value — but this time the prime movers were exporters and mining companies on speculation that a stronger dollar and higher metal prices would boost earnings. In the UK, equities were up despite testimony to Parliament from Bank of England Governor Mervyn King who said “continued fragility in the banking system poses the risk that money markets will tighten over the end of the year and could cause money market rates to rise.” And on Friday, European and UK stocks were up after Fed Chairman Bernanke signaled that he is open to cutting interest rates.

While last week’s gains did a lot to soften November’s losses, the FTSE, DAX and CAC still were down for the month by 4.3 percent, 1.9 percent and 3.0 percent respectively. The DAX has been the top performers so far this year — up 19.3 percent. The FTSE is up 3.4 percent while the CAC is up 2.3 percent.
Asian/Pacific indexes continued to rise on Friday after remarks by Fed Chairman Ben Bernanke and Fed Governor Frederic Mishkin in speeches on Thursday evening confirmed that the FOMC would be lowering interest rates when they meet on December 11. Asian export stocks especially were up on expectations the Fed would cut interest rates to support growth in their largest export market. And Hong Kong developers jumped on speculation the city's borrowing costs would follow U.S. rates lower and would boost demand for real estate. Hong Kong’s currency is pegged to the U.S. dollar and any change in U.S. monetary policy directly impacts Hong Kong as the Hong Kong Monetary Authority’s official interest rate typically tracks U.S. credit policy. The Hang Seng soared after a Chinese official said the country will proceed with a plan allowing individual purchases of the city's stocks. Australian indexes were up reflecting positive economic data on third quarter private capital expenditures which climbed 1.2 percent on the quarter and 12.2 percent on the year.

For the indexes followed here, November’s losses ranged from 2.7 percent (All Ordinaries) to 8.6 percent (Hang Seng). The Kospi lost 7.7 percent, the STI sank 7.5 percent, while the Nikkei was down 6.3 percent and the Topix was down 5.4 percent. The Nikkei and Topix are the only two followed here that are down in 2007 — they have lost 9.0 percent and 8.9 percent respectively.
Both the euro and yen were down last week against the U.S. dollar as equities regained some allure and riskier investments attracted investors once again after Fed officials tacitly said that an interest rate cut is in the cards on December 11. Analysts said the dollar’s rise was helped by strong gains in U.S. stocks following news that Abu Dhabi had taken a stake in Citigroup. The news helped calm fears over the health of the financial sector while at the same time boosting risk appetite and demand for carry trades. A statement from the People’s Bank of China following talks between Chinese and European officials also weighed on the euro, suggesting that China might slow its accumulation of the single currency.

Earlier in the week, the yen hit a two-and-a-half year high against the dollar after Bank of Japan governor Toshihiko Fukui expressed his concern about the turbulence in world markets, comparing it with “a serious disease”. The yen briefly rose to ¥107.17 against the dollar, but fell back to ¥108 in Tokyo trading. As a frame of reference, in late July when investors began to reverse some yen carry-trade positions as investors retreated from riskier assets, the Japanese currency had been trading at above ¥120 to the dollar. The increasing value of the yen has had a strong negative impact on Japanese equities as investors fretted about the impact of the stronger currency on exporter sales and profits.
EMU — M3 money supply for the three months ending in November jumped 11.7 percent when compared with the same three months a year earlier. For the month of November, M3 vaulted by 12.3 percent, easily a new record. Private sector lending also picked up to an 11.2 percent annual pace. Interpreting the money numbers has been complicated significantly in recent months by the hefty liquidity injections provided by the central bank in the wake of the U.S. sub-prime crisis and to this end, the headline figures may well overstate underlying growth rates. Nonetheless, the latest pick-up in money supply is nothing new; rather it simply extends a trend acceleration that essentially started back in 2004.

November flash harmonized index of consumer prices soared by 3.0 percent when compared with last year. This is the fastest pace since May 2001 (3.1 percent). As with all flash reports, no detail was available. This will be particularly worrisome for the ECB — the Bank sets its inflation target to just under 2 percent.

Third quarter gross domestic product was up 0.7 percent and 2.7 percent when compared with the same quarter a year ago. Private consumption led the way with an increase of 0.5 percent and 1.6 percent on the year which was supported by a 0.9 percent quarterly gain in fixed capital formation, a 0.6 percent rise in government consumption and a 2.5 percent advance by exports. Aggregate domestic demand was up 0.8 percent but net trade made a small negative impact as imports increased by 2.7 percent.

EU — November economic sentiment declined to a reading of 104.8 from 106.0 in October. However, the composition was mixed with the entire decline attributable to the consumer sector where confidence fell to minus 8 from minus 6 in contrast to industry where it rose to 3 from 2. Despite the collapse in German retail sales in October, confidence in the retail sector actually rose to a reading of 2 from the prior minus 2 while the service sector dropped to a reading of 14 from 18. Despite the mixed performance, the bigger picture remains rather worrisome with the latest overall drop in sentiment constituting the sixth in a row.

Germany — Third quarter gross domestic product growth was confirmed at 0.7 percent on the quarter and 2.5 percent when compared with the same quarter a year ago. The entire quarterly advance was derived from domestic demand which was up 0.9 percent on the quarter. Private consumption climbed 0.5 percent and gross capital investment 0.6 percent. Equipment investment was up a more subdued 0.4 percent after climbing 0.9 percent in the second quarter and 3.8 percent in the first quarter.

November Ifo business sentiment index improved marginally to 104.2 from 103.9 in October. All of the gain was attributable to an increase in the current conditions index to 110.4 from 109.6 in the previous month. Business expectations edged down to 98.3 from 98.6 in October. At a sector level the performance was mixed with fresh declines in sentiment in retail (minus 9.2 from minus 6.8) and construction (minus 21.3 from minus 20.6). In contrast, manufacturing climbed to 19.3 from 17.8 and wholesale to 2.9 from 2.3.

November unemployment dropped by 53,000 as payrolls rose another solid 33,000. The decline reflected declines in both the West (37,000) and the East (16,000) and lowered the overall unemployment rate to 8.6 percent from 8.7 percent in the previous month. The unemployment rates in both East and West Germany declined to 14.5 percent and 7.1 percent respectively. Job vacancies were up 1,000 in November after increasing 4,000 in October suggesting that unemployment will continue to decline.

October total retail sales sank 2.7 percent and were down 4.4 percent when compared with last year. Excluding autos, sales plummeted 3.3 percent and were down 3.4 percent on the year. The monthly data are highly erratic and often subject to sizeable revision. Nonetheless, this latest retrenchment constitutes the largest monthly decline since the hike in VAT in January (4.5 percent) and at the very least fits in with other indicators of household behavior in signaling a very cautious consumer approach towards spending. Over the first ten months of 2007, total sales volumes are down 1.6 percent on the year and while the decline in the non-food sector is a little less marked, all of the major product areas show hefty declines with the exception of pharmaceuticals.

Italy — October producer prices were up 0.4 percent and 3.6 percent when compared with the same month a year ago. The major components were mixed with energy prices increasing 1.2 percent. More modest price gains were recorded for consumer goods (0.4 percent) and intermediate goods (0.1 percent). Capital goods edged down 0.1 percent. Excluding energy, the PPI was up 0.2 percent and 3.1 percent on the year.

United Kingdom — Third quarter gross domestic product expanded by 0.7 percent and 3.2 percent when compared with the same quarter a year ago — both 0.1 percentage point lower than the original estimate. From the output side, the service sector was up 0.9 percent and down from the original 1.0 percent estimate. Manufacturing production was also nudged a couple of notches lower to flat from 0.2 percent. Household consumption was up a robust 1.0 percent versus the previous period and gross fixed capital formation was even firmer at 1.6 percent. With government spending also growing 0.3 percent, total domestic expenditure climbed fully 1.2 percent or 3.5 percent on the year. Partly as a result of such strong local spending, net exports deteriorated quite sharply and subtracted 0.5 percentage points from GDP. The GDP deflator was up 2.6 percent annually, well down from the 3.7 percent pace seen in the second quarter.

Japan — October retail sales were up 2.6 percent and 0.8 percent when compared with the same month a year ago. While sales were up on an annual basis in August and September (0.5 percent), the monthly changes were negative for both months. The monthly data are very erratic. After gaining 3.9 percent in July, sales sank 3.9 percent in August and 1.5 percent in September only to rebound once again in October. Large store sales were down 1.8 percent on the year after sinking 2 percent in September. Retail sales continue to be characterized by steady weakness punctuated by the odd jump that is quickly turned around.

October industrial production was up 1.6 percent after sinking 1.4 percent in September. The index was up 3.5 percent when compared with the same month a year ago. General machinery, transport and electronics & parts contributed to the gain. Commodities (products) that contributed to the increase were semiconductor products machinery, large passenger cars and active matrix LCDs. Production dropped in September following a catch up surge in auto production in August as automakers rushed production to make up for production lost due to a parts supply shortage in July.

October unemployment rate held steady at 4 percent for the second month. Both the number of employed and those unemployed declined. Employment was up 17,000 on the month but was down by 130,000 from the same month a year ago while the number of unemployed declined 100,000 on the year. The labor participation remained weak at 60.6 percent, which would leave the 12- month average holding just above the post-war low as in the past few years. The lack of job creation continues to keep people from joining the workforce, and is also preventing stronger growth in household incomes that is needed to boost domestic demand in a sustainable manner.

November Tokyo consumer price index was down 0.3 percent and up 0.3 percent when compared with last year. Core CPI which excludes fresh food only, was unchanged on the month and up 0.1 percent on the year. Excluding both food and energy the core CPI was unchanged on the month and down 0.1 percent on the year. October national CPI was up 0.3 percent on the month and on the year. Core CPI excluding fresh food only was up 0.2 percent on the month and 0.1 percent on the year. Record global oil prices, rising food prices caused by drought in major crop exporting nations and summer heat wave conditions in Japan, as well as price pressures emerging in service industries, combined to increase prices. Food prices were up 0.2 percent and 0.9 percent on the year while fuel, light & water charges were up 0.7 percent on the month and 1.0 percent on the year.

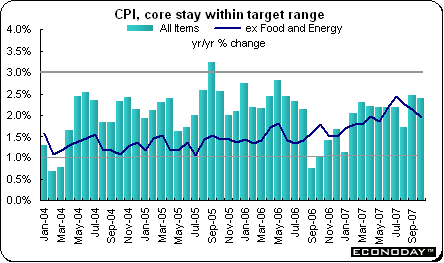
Canada — October consumer price index declined 0.3 percent and was up 2.4 percent when compared with the same month a year ago. Core CPI, which excludes food and energy, was down 0.1 percent and was up 2.0 percent on the year. The Bank of Canada’s core CPI which excludes eight volatile items declined 0.2 percent and was up 1.8 percent on the year, its slowest pace since June 2006 and, more importantly, nicely below the mid-point of its control target range. In terms of the overall CPI, the monthly decline in the index was led by declines in prices for transportation (1.5 percent), energy (1.5 percent), recreation, education and reading (0.7 percent) and clothing (0.3 percent). Most of the other main categories also posted minor declines with the only notable exception being shelter (up 0.8 percent).
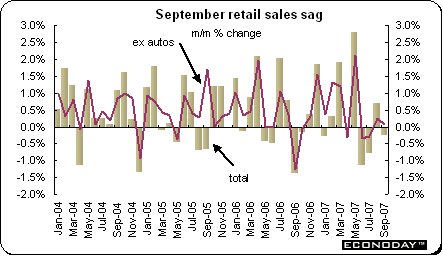
September retail sales unexpectedly dropped by 0.2 percent, the third decline in four months. The decline was led by new cars. Excluding automotive-related goods, retail sales were up 0.1 percent. Sales at furniture and electronics stores fell 2.2 percent, the most since May 2005. For the third quarter, total sales were down 0.3 percent for the first quarterly decline since the end of 2003. That followed two straight quarters of retail sales growth of at least 2 percent.
October industrial product price index was down 1.1 percent and down 1.0 percent when compared with last year. This was the sixth consecutive monthly decline for the IPPI. Forcing the index lower on the month were another exchange rate driven drop in motor vehicles prices (3.1 percent) and a chunky fall in pulp and paper prices (1.9 percent) that sustained the downward trend that began in March. Excluding prices for petroleum and coal products the IPPI was down 1.2 percent.
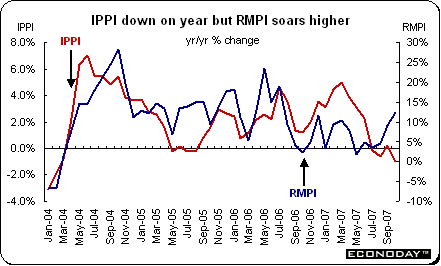
October raw material price index was up 0.3 percent and 12.5 percent when compared with last year, the fastest pace since July 2006. A 0.9 percent increase in crude oil costs was the main factor forcing the index higher. Excluding crude, the RMPI would have declined 0.2 percent. Over the year, non-fuel prices were up 4.0 percent or some 8.5 percent less than the total RMPI. Elsewhere, prices for vegetable products were up 5.0 percent which compounded the even larger 6.5 percent bounce posted in September as the cost of grain jumped 10.1 percent. Prices for animals and animal products, however, fell 2.1 percent as excess supply drove down costs for cattle and hogs for slaughter. Prices also fell for ferrous metals (3.3 percent) and wood (0.7 percent).
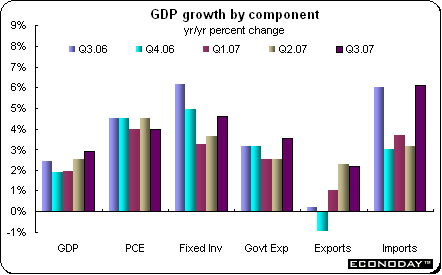
Third quarter gross domestic product was up 0.7 percent and 2.9 percent when compared with the same quarter a year ago. Among the major expenditure components, the key consumer sector decelerated on the back of poor auto sales (down 2.6 percent) but still helped to underpin the advance in overall GDP with a quarterly gain of 0.7 percent. Business investment in machinery and equipment rose a solid 3.6 percent with investment in transportation up some 14 percent. Housing also continued to expand with a 1.2 percent bounce in renovation providing a notable boost. Government spending rose 0.8 percent but the other main contributor to growth was business inventories which surged some C$15 billion. Predictably, the main negative was net trade which deteriorated sharply over the quarter in large part in response to the dramatic appreciation of the local currency. Therefore a relatively gentle 0.6 percent increase in exports was easily outpaced by a 4.4 percent jump in imports. The GDP deflator reflected the recent slowdown seen in the CPI with a 0.3 percent decline on the quarter.
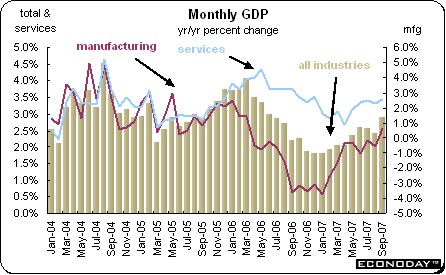
September monthly gross domestic product edged up 0.1 percent and was up 2.9 percent when compared with last year. All of the monthly gain was derived from the service sector which increased output by 0.2 percent. Goods producing contracted by 0.1 percent with manufacturing down a chunky 0.9 percent. Sixteen of the 21 manufacturing groups saw production decline. The construction sector, however, advanced 0.4 percent, bolstered by increases in residential construction (0.8 percent) and engineering and repair work (0.3 percent). Output in the energy sector rose 0.8 percent.
Markets last week were driven in large part by a combination of Fedspeak combined with the release of the pre-FOMC meeting Beige Book that outlined anecdotal evidence that the economy was weakening from its third quarter vigorous performance. Equities soared after a speech by Fed Vice Chairman Donald Kohn which was interpreted to mean that the Fed would cut interest rates again at their December 11 meeting. His remarks were reinforced by those of Chairman Bernanke and Fed Governor Mishkin later in the week. U.S. housing data continued to be dismal while inflation data in Europe could not be welcome news for the ECB.
Next week, the Reserve Bank of Australia, Banks of Canada and England and the European Central Bank all hold policy meetings. (The FOMC meeting is the following week.) It is expected that all will maintain their current interest rate levels of 6.75 percent, 4.5 percent, 4.75 percent and 4.0 percent respectively. While some analysts think there is a chance for rate cuts in the UK and Canada, most expect no rate cuts until 2008 although they acknowledge it could be a close call. The OECD will release its semi-annual forecast on Thursday.
| Central Bank activities |
|
| December 4 |
Canada |
Bank of Canada Monetary Policy Announcement |
| December 5 |
Australia |
Reserve Bank of Australia Monetary Policy Announcement |
| December 5,6 |
UK |
Bank of England Meeting |
| December 6 |
EMU |
European Central Bank Meeting |
|
|
|
| The following indicators will be released this week... |
| Europe |
|
|
| December 3 |
EMU |
Unemployment (October) |
| December 4 |
EMU |
Producer Price Index (October) |
| December 5 |
EMU |
Retail Sales (October) |
| December 6 |
Germany |
Manufacturing Orders (October) |
|
UK |
Industrial and Manufacturing Output (October) |
|
|
|
| Asia/Pacific |
|
|
| December 3 |
Australia |
Merchandise Trade Balance (October) |
| December 4 |
Australia |
Retail Sales (October) |
| December 5 |
Australia |
Gross Domestic Product (Q3.07) |
| December 7 |
Japan |
Gross Domestic Product (Q3.07 revised) |
|
|
|
| Americas |
|
|
![[Econoday]](images/econoday_logo_slim.gif)
Important Legal Notice: Econoday has attempted to verify the information contained in this calendar. However, any aspect of such info may change
without notice. Econoday does not provide investment advice, and does not represent that any of the information or related analysis is accurate or complete at any time.
Consensus Data Sources: Econoday Consensus Survey and Market News
|
| |
| Legal Notices | ©Copyright 1998-2024 Econoday, Inc. |
powered by ![[Econoday]](images/logo.gif)
|
| |
|
Econoday Suggestion Box: We welcome your ideas on how we can serve you better.
|
| 
