|
Earnings for the fourth quarter on average fell short of expectations in the first week of reports. And economic news was mixed and unable to overcome market worries about the recovery possibly slipping.
 The opening of earnings season was a net negative for equities this past week as economic news was mixed. News out of China boosted the Blue Chips on Monday as the country reported an all-time high for imports in December. Caterpillar in particular benefitted from the news. Citigroup helped the financial sector after a key stockholder announced that the worst was over for the U.S bank. But the negative news on earnings began after close on Monday with Alcoa reporting worse-than-expected profits. That carried over to declines in equities in general on Tuesday. A profit warning by Chevron also bumped stocks down for the day. Finally, China came to the fore again on Tuesday as the government ordered banks to set aside more reserves to slow economic growth. The opening of earnings season was a net negative for equities this past week as economic news was mixed. News out of China boosted the Blue Chips on Monday as the country reported an all-time high for imports in December. Caterpillar in particular benefitted from the news. Citigroup helped the financial sector after a key stockholder announced that the worst was over for the U.S bank. But the negative news on earnings began after close on Monday with Alcoa reporting worse-than-expected profits. That carried over to declines in equities in general on Tuesday. A profit warning by Chevron also bumped stocks down for the day. Finally, China came to the fore again on Tuesday as the government ordered banks to set aside more reserves to slow economic growth.
Midweek was the highlight for equities as U.S. stocks rebounded from the first loss of the year for the S&P 500. The gains were largely on upgrades by analysts. Slight improvement in the economy was reported in the Fed’s Beige Book, providing additional modest lift to stocks.
Equities went against the weight of economic news on Thursday. Stocks rose ahead of Intel’s earnings despite an unexpected decline in retail sales and rise in jobless claims. Friday was the worst day of 2010 for most indexes. The big movers were JP Morgan and Intel. JP Morgan Chase reported a better-than-expected quarterly profits but revenue was short of forecasts. Also, JP Morgan reported large losses on credit card and mortgage loans, causing concern that consumer credit is not improving. Intel topped estimates on both earnings and sales after the close of trade Thursday. But Intel stock dropped on concern that it was overvalued. Consumer sentiment falling short of forecasts also pushed equities down for the day. Sluggish retail sales and consumer sentiment also had traders worrying that the recovery might falter.
Equities were down this past week. The Dow was down 0.1 percent; the S&P 500, down 0.8 percent; the Nasdaq, down 1.3 percent; and the Russell 2000, down 1.0 percent.
For the year-to-date, major indexes are up as follows: the Dow, up 1.7 percent; the S&P 500, up 1.9 percent; the Nasdaq, up 0.8 percent; and the Russell 2000, up 2.0 percent.
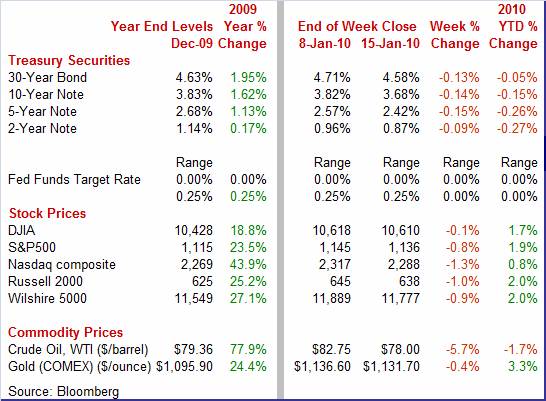
Weekly percent change column reflects percent changes for all components except interest rates. Interest rate changes are reflected in simple differences.
 Except for the short-end, Treasury yields fell significantly this past week. Rates fell the most on Tuesday on a solid 3-year note auction as direct bidding (by non-primary dealers for their own accounts) was quite strong. Also, an announcement by China of increased reserve requirements for its banks raised concern that economic growth will not be as strong as expected in coming quarters. Flight to safety also weighed on yields as equities declined for the day. Except for the short-end, Treasury yields fell significantly this past week. Rates fell the most on Tuesday on a solid 3-year note auction as direct bidding (by non-primary dealers for their own accounts) was quite strong. Also, an announcement by China of increased reserve requirements for its banks raised concern that economic growth will not be as strong as expected in coming quarters. Flight to safety also weighed on yields as equities declined for the day.
 Rates firmed on Wednesday on poor results for the 10-year T-note auction, reversal of flight to safety, and on a Beige Book indicating modest improvement in the economy. Rates firmed on Wednesday on poor results for the 10-year T-note auction, reversal of flight to safety, and on a Beige Book indicating modest improvement in the economy.
Economic indicator news played key roles in bumping rates back down the last two days of the week as retail sales unexpectedly fell in December, jobless claims rose, and consumer sentiment did not rise as much as hoped.
For this past week Treasury rates were mostly down as follows: the 2-year note, down 9 basis points; the 5-year note, down 15 basis points; the 7-year note, down 16 basis points; the 10-year bond, down 14 basis points; and the 30-year bond, down 13 basis points. The 3-month T-bill rate ticked up by 1 basis point.
Despite this past week’s dip in most Treasury rates, the long bond yield remains relatively elevated over supply concerns. The shorter-maturity notes have eased recently while the 3-month T-bill is still tied to the Fed’s near zero target for the fed funds rate.
 Crude oil prices steadily declined throughout last week. Warmer weather and forecasts for warmer weather in many parts of the U.S. were key reasons for the drop in the spot price of West Texas Intermediate, which lowered the demand for heating oil. China’s move to curb liquidity by raising bank reserve requirements also weighed on prices due to the impact on expected economic growth in China. Crude oil prices steadily declined throughout last week. Warmer weather and forecasts for warmer weather in many parts of the U.S. were key reasons for the drop in the spot price of West Texas Intermediate, which lowered the demand for heating oil. China’s move to curb liquidity by raising bank reserve requirements also weighed on prices due to the impact on expected economic growth in China.
At mid-week, unexpectedly high inventories bumped prices down. Weak retail sales and a lower-than-expected rise in consumer confident also pulled down crude price in the latter part of the week.
Net for the week, spot prices for West Texas Intermediate dropped a sharp $4.75 per barrel to settle at $78.00. The latest is notably lower than last week’s recent high of $82.75 per barrel but still significantly higher than December’s average of $74.42 per barrel and the recession low of $31.41 in December 2008.
 An ongoing issue is where the latest oil prices are in terms of seasonal expectations. Oil prices typically decline in January so it is important to compare on a seasonally adjusted basis. This helps to indicate how oil might impact the January CPI, PPI, or PCE price index. An ongoing issue is where the latest oil prices are in terms of seasonal expectations. Oil prices typically decline in January so it is important to compare on a seasonally adjusted basis. This helps to indicate how oil might impact the January CPI, PPI, or PCE price index.
 Thus far in January, the average for the spot price of West Texas Intermediate is $81.22 per barrel and is still well above December’s average despite recent price declines. On a seasonally adjusted basis, WTI is $96.47 per barrel for January and is up 12.5 percent over the December level of $85.75 per barrel. This suggests upward pressure on the energy components of inflation indicators for January. Of course, oil could continue to decline the remainder of the month and pull down the average. Thus far in January, the average for the spot price of West Texas Intermediate is $81.22 per barrel and is still well above December’s average despite recent price declines. On a seasonally adjusted basis, WTI is $96.47 per barrel for January and is up 12.5 percent over the December level of $85.75 per barrel. This suggests upward pressure on the energy components of inflation indicators for January. Of course, oil could continue to decline the remainder of the month and pull down the average.
It was a mixed bag this past week. Retail sales disappointed for December but consumer sentiment edged up. Industrial production was weak at the manufacturing level for December but Empire State manufacturing improved in January. The international trade deficit worsened in December on higher oil prices. On the inflation front, the CPI was tame while import prices were mixed in their most recent reports.
 The consumer in December did not keep up the strong pace we saw in November and, in fact, retrenched a bit. Overall retail sales in December fell 0.3 percent after a 1.8 percent surge in November. Excluding autos, sales decreased 0.2 percent after jumping 1.9 percent in November. Excluding both autos and gasoline, the December number still was disappointing, declining 0.3 percent, following a 1.0 percent boost in November. The consumer in December did not keep up the strong pace we saw in November and, in fact, retrenched a bit. Overall retail sales in December fell 0.3 percent after a 1.8 percent surge in November. Excluding autos, sales decreased 0.2 percent after jumping 1.9 percent in November. Excluding both autos and gasoline, the December number still was disappointing, declining 0.3 percent, following a 1.0 percent boost in November.
Part of the unexpected weakness in the latest month was due to a 0.8 percent fall in motor vehicle sales (a relatively large component). A large fall also was seen in electronics & appliance store sales which were down 2.6 percent. Overall, the declines in December were broad based. However, gasoline station sales were up 1.0 percent after a huge 9.6 percent surge in November.
It is hard to make too much out of December’s decrease in sales, given that November was so robust. On average, sales for the quarter were respectable and should show up in a decent increase in real PCEs for the fourth quarter in GDP.
Even though the recovery is not gangbusters for the retail sector, it still has made significant progress since the recession. Overall retail sales on a year-ago basis in December increased to up 5.4 percent, from up 2.5 percent in November. Excluding motor vehicles, the year-on-year rate improved to up 5.2 percent in December from up 2.0 percent in November.
 The fundamentals for consumer spending remain on the weak side with consumer sentiment a key indicator remaining significantly low. Although sentiment is up from recession lows, improvement in recent months has stalled. The Reuters/University of Michigan's consumer sentiment index was little changed in the mid-January reading, at 72.8 compared to December's final 72.5. The index has held in a very narrow and depressed range in recent months, from a low of 66.0 in mid-November to a high of 73.5 in final September. The expectations component, the report's leading component, has held in a similar range, falling 1.4 points in the latest reading to 67.5. This indicates wide pessimism over the economic outlook, most likely reflecting expectations of unemployment remaining high for some time. The current conditions component, at 81.0, did improve but not substantially. The fundamentals for consumer spending remain on the weak side with consumer sentiment a key indicator remaining significantly low. Although sentiment is up from recession lows, improvement in recent months has stalled. The Reuters/University of Michigan's consumer sentiment index was little changed in the mid-January reading, at 72.8 compared to December's final 72.5. The index has held in a very narrow and depressed range in recent months, from a low of 66.0 in mid-November to a high of 73.5 in final September. The expectations component, the report's leading component, has held in a similar range, falling 1.4 points in the latest reading to 67.5. This indicates wide pessimism over the economic outlook, most likely reflecting expectations of unemployment remaining high for some time. The current conditions component, at 81.0, did improve but not substantially.
 The Fed got its wish with the December CPI—inflation is subdued. Headline consumer price inflation eased to 0.1 percent from 0.4 percent in November. Core CPI inflation also was soft at 0.1 percent although higher than November’s flat reading. Weakness in the CPI was largely in the housing component and especially the shelter subcomponent which was flat and reflected the weak housing market and high vacancy rates in apartments. The Fed got its wish with the December CPI—inflation is subdued. Headline consumer price inflation eased to 0.1 percent from 0.4 percent in November. Core CPI inflation also was soft at 0.1 percent although higher than November’s flat reading. Weakness in the CPI was largely in the housing component and especially the shelter subcomponent which was flat and reflected the weak housing market and high vacancy rates in apartments.
Food and energy components were up in the latest month but at a relatively moderate pace for both. Energy rose only 0.2 percent after a 4.1 percent surge in November. Food inflation firmed to 0.2 percent from a 0.1 percent rise in November.
 Within the core, housing inflation was flat as was the shelter subcomponent. New vehicle prices fell 0.3 percent but used car & truck prices increased 2.5 percent as the cash for clunkers program took a sizeable segment off the used market. Recreation was down a sharp 0.4 percent in December while a modest 0.1 percent gain in medical care also helped keep the core sluggish. However, apparel rebounded 0.4 percent but followed two months of declines. Within the core, housing inflation was flat as was the shelter subcomponent. New vehicle prices fell 0.3 percent but used car & truck prices increased 2.5 percent as the cash for clunkers program took a sizeable segment off the used market. Recreation was down a sharp 0.4 percent in December while a modest 0.1 percent gain in medical care also helped keep the core sluggish. However, apparel rebounded 0.4 percent but followed two months of declines.
While the month-ago numbers for December were tame, that was not the case for the year-ago figures. Year-on-year, headline inflation jumped to 2.8 percent (seasonally adjusted) from 1.9 percent in November. The core rate edged up in December to 1.8 percent from 1.7 percent the month before. On an unadjusted year-ago basis, the headline number was up 2.7 percent in December while the core was up 1.8 percent. Part of the reason the headline number jumped so much year-on-year is that the CPI had just had a string of negative monthly changes in the fourth quarter of 2008, pulling down the baseline for today’s year-ago figure. Whether the headline year-ago pace eases will depend heavily on whether oil prices stabilize or even come off recent highs. Overall, lingering effects of the recession (including a sluggish consumer sector and very weak housing sector) are keeping core inflation subdued.
 Headline import prices were unchanged in December after a 1.6 percent jump the month before. The December number was weak thanks to a drop in petroleum prices which were down 2.0 percent after a 6.3 percent surge the month before. In contrast, non-petroleum import prices rose 0.5 percent, following a 0.6 percent gain in November. Upward pressure was in the industrial supplies ex-petroleum component which advanced 2.2 percent versus plus 2.8 percent and plus 2.2 percent in the prior two months. Foods, feeds & beverages also were up, increasing 0.9 percent for a second month in a row. But the price pressure from imported commodities is not yet showing up in final goods where import prices for consumer goods were unchanged and capital goods were up only 0.1 percent in December. Headline import prices were unchanged in December after a 1.6 percent jump the month before. The December number was weak thanks to a drop in petroleum prices which were down 2.0 percent after a 6.3 percent surge the month before. In contrast, non-petroleum import prices rose 0.5 percent, following a 0.6 percent gain in November. Upward pressure was in the industrial supplies ex-petroleum component which advanced 2.2 percent versus plus 2.8 percent and plus 2.2 percent in the prior two months. Foods, feeds & beverages also were up, increasing 0.9 percent for a second month in a row. But the price pressure from imported commodities is not yet showing up in final goods where import prices for consumer goods were unchanged and capital goods were up only 0.1 percent in December.
On a year-ago basis, overall import prices were up 8.6 percent in December with nonpetroleum down 0.2 percent.
 According to the latest U.S. trade report, world trade is expanding. The overall U.S. trade gap widened to $36.4 billion from a revised $33.2 billion shortfall in October. Exports gained another 0.9 percent while imports surged 2.6 percent. According to the latest U.S. trade report, world trade is expanding. The overall U.S. trade gap widened to $36.4 billion from a revised $33.2 billion shortfall in October. Exports gained another 0.9 percent while imports surged 2.6 percent.
 The worsening in the trade deficit in the latest month was largely due to an expansion of the petroleum deficit, which came in at $19.9 billion compared to a differential of $17.8 billion the previous month. The widening in the petroleum deficit was due to sharply higher prices as the number of barrels imported declined. Physical barrels imported fell 5.2 percent, following a 9.6 drop in October. The price of imported oil jumped to $72.54 per barrel from $67.39 in October. However, the nonpetroleum gap also grew—to $27.1 billion from $25.6 billion in October. The worsening in the trade deficit in the latest month was largely due to an expansion of the petroleum deficit, which came in at $19.9 billion compared to a differential of $17.8 billion the previous month. The widening in the petroleum deficit was due to sharply higher prices as the number of barrels imported declined. Physical barrels imported fell 5.2 percent, following a 9.6 drop in October. The price of imported oil jumped to $72.54 per barrel from $67.39 in October. However, the nonpetroleum gap also grew—to $27.1 billion from $25.6 billion in October.
Both imports and exports have been rising in recent months—a sharp contrast to the worst of the recession. Exports have risen seven months in a row. And this is good news for U.S. manufacturers. Imports have posted gains in five of the last six months—an indication that businesses expect a rise in domestic demand.
 Manufacturing has shown some volatility recently but you have to look past the headlines to see the full picture. Industrial production was strong in December at the headline level but the detail showed some weakening within manufacturing. Growth in industrial production in December posted a sizable 0.6 percent gain, after a healthy 0.6 percent boost in November. The manufacturing component, however, fell 0.1 percent after surging 0.9 percent in November. For the latest month, utilities output spiked 5.9 percent in December on atypically cold weather while mining output rose 0.2 percent. Manufacturing has shown some volatility recently but you have to look past the headlines to see the full picture. Industrial production was strong in December at the headline level but the detail showed some weakening within manufacturing. Growth in industrial production in December posted a sizable 0.6 percent gain, after a healthy 0.6 percent boost in November. The manufacturing component, however, fell 0.1 percent after surging 0.9 percent in November. For the latest month, utilities output spiked 5.9 percent in December on atypically cold weather while mining output rose 0.2 percent.
 Within manufacturing, durables edged up 0.1 percent while nondurables dipped 0.1 percent. Within durables, major components were mixed with the strongest gain in machinery and the largest loss in nonmetallic metals. Motor vehicle production was down as assemblies of motor vehicles declined in December to 7.06 million units annualized from 7.20 million in November. The weakness in nondurables was widespread but followed a very strong November. Within manufacturing, durables edged up 0.1 percent while nondurables dipped 0.1 percent. Within durables, major components were mixed with the strongest gain in machinery and the largest loss in nonmetallic metals. Motor vehicle production was down as assemblies of motor vehicles declined in December to 7.06 million units annualized from 7.20 million in November. The weakness in nondurables was widespread but followed a very strong November.
Resource utilization is still low in the industrial sector but rising. The overall capacity utilization rate rose to 72.0 percent from 71.5 percent in November and came in marginally above market expectations for 71.9 percent.
The two key takeaways from the latest industrial production report are that December was not as healthy as suggested by the headline and that on average manufacturing remains healthy. Even though the December number should be seen a disappointing in terms of a weak manufacturing component, it is not disconcerting given that it followed such a strong November.
 Manufacturing appears to be starting off the New Year on the right foot as the New York Fed’s Empire State manufacturing index jumped in January to 15.92 from 4.50 the month before. Both are above the survey’s breakeven point of zero and the higher figure for January is comparable to a stronger growth rate for manufacturing. Manufacturing appears to be starting off the New Year on the right foot as the New York Fed’s Empire State manufacturing index jumped in January to 15.92 from 4.50 the month before. Both are above the survey’s breakeven point of zero and the higher figure for January is comparable to a stronger growth rate for manufacturing.
And it looks like forward momentum has picked up as the new orders index surged to 20.48 from December's 2.77. Unfilled orders also were up, coming in at 2.67 from minus 21.05 in November.
The improved outlook is starting to impact the manufacturing workforce in New York State as the number of employees index turned mildly positive at 4.00 versus minus 5.26 in December. According to the survey sample, manufacturers started to rehire in January.
Despite recent volatility in manufacturing, it appears that this sector is still on a moderately strong uptrend and continues to support the recovery. The consumer sector, however, does not appear to be showing any growth in forward momentum and remains lackluster in terms of fundamentals. Inflation is subdued according to the latest readings but uncertainty about the direction of energy costs raises some question marks about where inflation is headed in coming months.
The big market movers are out on Wednesday with both the housing starts and PPI reports. The Analysts will be looking for the impact of extended and expanded tax credits to homebuyers on housing starts. The PPI may give hints on whether underlying price pressures are starting to pick up or not.
U.S. Holiday: Martin Luther King, Jr. Day. All Markets Closed.
Housing starts in November rebounded 8.9 percent, following a revised 10.1 percent plummet in October. The comeback in November to a pace of 0.574 million units annualized was led by a 67.3 percent rebound in multifamily starts, following a sharp 29.5 percent plunge in October. Meanwhile the single-family component edged up a merger 2.1 percent after a 7.1 percent fall the month before. For December, analysts are hoping the extension of tax credits to potential home buyers will boost starts. But homebuilders may still be worried that supply is still a little high and may not boost the pace of new construction out of fear of getting stuck with unsold homes and payments on construction loans. Focus should be on the less volatile single-family component.
Housing starts Consensus Forecast for December 09: 0.579 million-unit rate
Range: 0.520 million to 0.600 million-unit rate
The producer price index jumped 1.8 percent in November after gaining 0.3 percent in October. The November gain was led by a 6.9 percent spike in energy and a 0.5 percent gain for food. At the core level, the PPI rebounded 0.5 percent after a huge 0.6 percent drop in October. Looking ahead, the headline PPI is likely to be soft if the uptick of 0.1 percent in the December CPI is an indication. But the PPI does not have services components and will not be helped by weak shelter costs as was the case with the CPI. Higher energy costs likely will have more impact on the PPI than was the case with the CPI.
PPI Consensus Forecast for December 09: +0.0 percent
Range: -0.2 to +0.2 percent
PPI ex food & energy Consensus Forecast for December 09: +0.1 percent
Range: 0.0 to +0.2 percent
Initial jobless claims rose 11,000 to 444,000 for the week ending January 9. However, the four-week average declined 9,000 to 440,750, continuing a consecutive downtrend for 19 straight weeks. Clearly, the trend is that firms are laying off workers at a slower rate but are not yet willing to start hiring new workers.
Jobless Claims Consensus Forecast for 1/16/10: 440,000
Range: 435,000 to 450,000
The Conference Board's index of leading indicators rose a strong 0.9 percent in November, following a 0.3 percent boost the month before. November's increase was led by the yield curve component which had a 0.33 percentage point contribution, followed by initial unemployment claims, 0.26 percentage points, and the average workweek for manufacturing, 0.19 percentage points. Also making positive contributions were building permits, stock prices, and money supply. The coincident indicator rose 0.2 percent in November, following no change the month before. Looking ahead, the leading index should post another advance with the yield curve likely the strongest contributor. A sizeable positive contribution is also expected from initial jobless claims with a number of other components having marginally positive contributions. Real money supply may tug down slightly on the December leading index.
Leading indicators Consensus Forecast for December 09: +0.7 percent
Range: +0.4 to +0.9 percent
The general business conditions component of the Philadelphia Fed's business outlook survey index rose rose more than 3-1/2 points in December to 22.5, indicating strong month-to-month acceleration in the region's manufacturing sector. However, we may see some softening in growth in January as the new orders index in December came at only 8.3 while the unfilled orders index was 1.7. These numbers reflect annual revisions to seasonal factors. The December business outlook index was originally published as 20.4.
Philadelphia Fed survey Consensus Forecast for January 10: 18.0
Range: 5.6 to 21.5
R. Mark Rogers is the author of The Complete Idiot’s Guide to Economic Indicators, Penguin Books, October 2009.
Econoday Senior Writer Mark Pender contributed to this article.
|
