|
Two advance reports on the nation's manufacturing sector show sudden and significant weakness. They follow in the wake of steel and aluminum tariffs that were put in place in March and are being cited as a central factor behind what are rising costs and also rising selling prices in the manufacturing sector. The week's data also include housing updates but here the news is less urgent but still significant for second-quarter GDP.
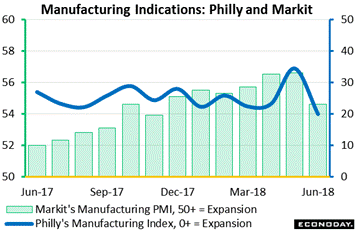 U.S. manufacturing may be in secular decline but pivots in the sector may still offer an advance signal of pivots for the economy as a whole. And two advance readings for this forward-looking sector are both signaling a pivot lower for June. The Philly Fed index, which is a centerpiece of the economic calendar, is still showing a solid rate of growth but the pace of growth, at 19.9 as tracked in the blue line of the graph, is suddenly the slowest over the last year-and-a-half, since November 2016 when this index started to take off. The green columns of the graph track the manufacturing PMI which is produced by Markit Economics and where growth this month has slowed to a 7-month low. Markit describes its result as a "clear loss of momentum." New orders in both reports are down with exports in the Markit report, a reading not tracked in the Philly report, at a 2-year low. U.S. manufacturing may be in secular decline but pivots in the sector may still offer an advance signal of pivots for the economy as a whole. And two advance readings for this forward-looking sector are both signaling a pivot lower for June. The Philly Fed index, which is a centerpiece of the economic calendar, is still showing a solid rate of growth but the pace of growth, at 19.9 as tracked in the blue line of the graph, is suddenly the slowest over the last year-and-a-half, since November 2016 when this index started to take off. The green columns of the graph track the manufacturing PMI which is produced by Markit Economics and where growth this month has slowed to a 7-month low. Markit describes its result as a "clear loss of momentum." New orders in both reports are down with exports in the Markit report, a reading not tracked in the Philly report, at a 2-year low.
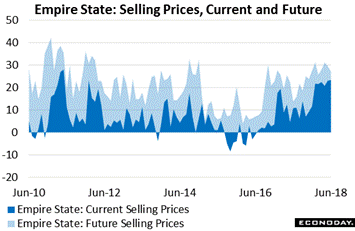 Another common theme in the reports is a rise in price pressures -- pressures which do appear to be getting passed through to customers. The outlook for future selling prices in the Philly report surged dramatically to 56.6 for the highest reading in nearly 30 years, since December 1988. Respondents in Markit's manufacturing report, as well as its services report for June, are reporting steel-related price increases as other respondents in other suveys have been since tariffs were imposed. Prices are also up in the Empire State report where the graph's dark blue of current selling prices is tracked against the light blue background of future selling prices. Empire State, which was the first to post its June results, is not showing slowing in orders or activity but, as is visible in the graph, it is showing the greatest amont of inflation pass through and expected pass through since the easy comparisons early on in the expansion 8 years ago. Another common theme in the reports is a rise in price pressures -- pressures which do appear to be getting passed through to customers. The outlook for future selling prices in the Philly report surged dramatically to 56.6 for the highest reading in nearly 30 years, since December 1988. Respondents in Markit's manufacturing report, as well as its services report for June, are reporting steel-related price increases as other respondents in other suveys have been since tariffs were imposed. Prices are also up in the Empire State report where the graph's dark blue of current selling prices is tracked against the light blue background of future selling prices. Empire State, which was the first to post its June results, is not showing slowing in orders or activity but, as is visible in the graph, it is showing the greatest amont of inflation pass through and expected pass through since the easy comparisons early on in the expansion 8 years ago.
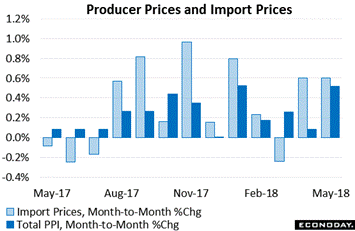 Jerome Powell in his FOMC press conference earlier this month conceded that reports such as these as well as the Fed's own business contacts have been reporting building price pressures, yet he stressed that these pressures have yet to appear in the government's data? Let's look back at inflation data released in the prior week for clues. Producer prices for May, tracked in the dark column at the far right of the graph, rose 0.5 percent which is the highest monthly jump since January and is in fact one of the very highest of the whole expansion. Oil was a big factor in the PPI's rise but sharp gains for steel and aluminum at the intermediate level were also evident and no doubt played their part in a 1.0 percent spike for final goods. The light blue columns are import prices which have posted 0.6 percent gains the past 2 months with the yearly rate over 4 percent which is another expansion high. If producer prices and import prices move further higher in June, we can look back at reports like Philly and Markit as offering fair warning. Jerome Powell in his FOMC press conference earlier this month conceded that reports such as these as well as the Fed's own business contacts have been reporting building price pressures, yet he stressed that these pressures have yet to appear in the government's data? Let's look back at inflation data released in the prior week for clues. Producer prices for May, tracked in the dark column at the far right of the graph, rose 0.5 percent which is the highest monthly jump since January and is in fact one of the very highest of the whole expansion. Oil was a big factor in the PPI's rise but sharp gains for steel and aluminum at the intermediate level were also evident and no doubt played their part in a 1.0 percent spike for final goods. The light blue columns are import prices which have posted 0.6 percent gains the past 2 months with the yearly rate over 4 percent which is another expansion high. If producer prices and import prices move further higher in June, we can look back at reports like Philly and Markit as offering fair warning.
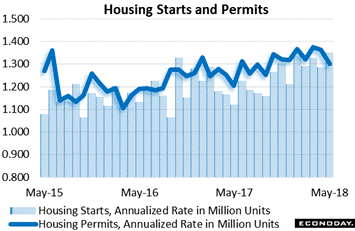 Housing indications, unlike those for manufacturing, are not showing any changes; they continue to be mixed with saw-tooth patterns the norm. The good news in May's housing starts report is centered in the present, less so in the outlook. Starts jumped 5.0 percent in the month to a 1.350 million annualized rate that should give a boost to residential investment in the second-quarter GDP report. The question of future building is still positive but definitely did not improve in the May report as building permits fell for a second straight month and very steeply, down 4.6 percent to a 1.301 million rate. Permit weakness includes single-family homes, down 2.2 percent to an 844,000 rate, and once again multi-family units which fell 8.8 percent to a 457,000 rate. Housing indications, unlike those for manufacturing, are not showing any changes; they continue to be mixed with saw-tooth patterns the norm. The good news in May's housing starts report is centered in the present, less so in the outlook. Starts jumped 5.0 percent in the month to a 1.350 million annualized rate that should give a boost to residential investment in the second-quarter GDP report. The question of future building is still positive but definitely did not improve in the May report as building permits fell for a second straight month and very steeply, down 4.6 percent to a 1.301 million rate. Permit weakness includes single-family homes, down 2.2 percent to an 844,000 rate, and once again multi-family units which fell 8.8 percent to a 457,000 rate.
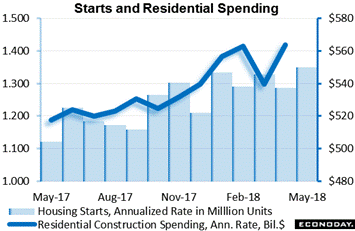 Let's magnify the time frame to the past year as seen in the graph. Starts have been holding tightly around a 1.300 rate for the past half year and based on permits are likely to continue to do so in the months ahead. This points to limited acceleration if any at all for residential construction spending which has been struggling at the $560 billion annualized line. Residential investment, which is one of GDP's six major components, likewise has a checkered record, pulling down the nation's growth in three of the last four quarters including this year's first quarter. The outlook for the second quarter's contribution from residential investment is up for grabs, at least based on starts and also anecdotal hints from the nation's home builders. Let's magnify the time frame to the past year as seen in the graph. Starts have been holding tightly around a 1.300 rate for the past half year and based on permits are likely to continue to do so in the months ahead. This points to limited acceleration if any at all for residential construction spending which has been struggling at the $560 billion annualized line. Residential investment, which is one of GDP's six major components, likewise has a checkered record, pulling down the nation's growth in three of the last four quarters including this year's first quarter. The outlook for the second quarter's contribution from residential investment is up for grabs, at least based on starts and also anecdotal hints from the nation's home builders.
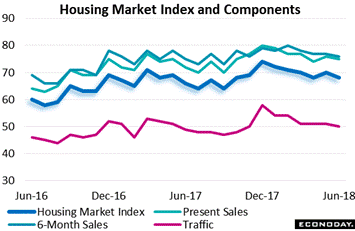 Home builders have been reporting less and less optimism all year. And their housing market index is not pointing to acceleration, edging back 2 points in June to a lower-than-expected 68. Tariff-related complaints have been on the rise among builders who say steel-related items are increasingly in short supply. Builders have also been having trouble finding workers to do the construction. The red line of the graph tracks a stubborn issue for builders and that's a lack of buyer traffic. Theories on why traffic hasn't recovered center on the effects from the subprime housing collapse 10 years ago: that it has locked in home owners who, even this long after the collapse, may still owe more on their house than its worth, and that for possible first-time buyers it has tarnished the attraction of wanting to own a home in the first place. Home builders have been reporting less and less optimism all year. And their housing market index is not pointing to acceleration, edging back 2 points in June to a lower-than-expected 68. Tariff-related complaints have been on the rise among builders who say steel-related items are increasingly in short supply. Builders have also been having trouble finding workers to do the construction. The red line of the graph tracks a stubborn issue for builders and that's a lack of buyer traffic. Theories on why traffic hasn't recovered center on the effects from the subprime housing collapse 10 years ago: that it has locked in home owners who, even this long after the collapse, may still owe more on their house than its worth, and that for possible first-time buyers it has tarnished the attraction of wanting to own a home in the first place.
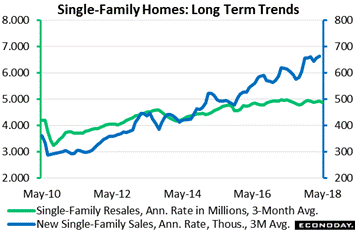 Yet new home sales and home builders have been doing well this expansion. One of the coming week's highlights will be May's update for new home sales which, as seen in the blue line, have been climbing steadily through the expansion, at just over 650,000 and approaching the 700,000 annualized rate. In sharp contrast, however, is the green line of the resales which have not shown any lift at all and what does hint that at least some homeowners can't get the price they need for their homes and are patiently sitting underwater. The rate for single-family resales has held at roughly 5.000 million annualized for nearly the last three years. Yet new home sales and home builders have been doing well this expansion. One of the coming week's highlights will be May's update for new home sales which, as seen in the blue line, have been climbing steadily through the expansion, at just over 650,000 and approaching the 700,000 annualized rate. In sharp contrast, however, is the green line of the resales which have not shown any lift at all and what does hint that at least some homeowners can't get the price they need for their homes and are patiently sitting underwater. The rate for single-family resales has held at roughly 5.000 million annualized for nearly the last three years.
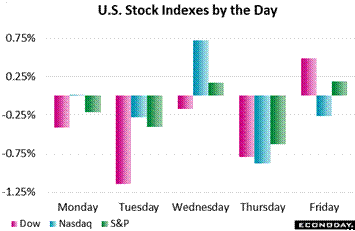 A rise in tariffs as a discrete risk to the market outlook is hard to pinpoint. Tariffs are likely of course to slow imports which would point to replacement production in the domestic economy, but retaliatory tariffs would point to an offsetting slowdown in exports. This tit-for-tat balancing is perhaps being expressed in the stock market's sideways movement. The Dow is only slightly lower than it was back in March when steel and aluminum tariffs were first announced. Interest rates have been showing much more movement but their climb, especially on the short-end of the curve, has been tied to rising expectations for Federal Reserve rate hikes. On the week, the Dow lost 2.0 percent to 24,580 and moved into the negative column for the year at minus 0.6 percent. But oil was the week's big mover, up 7.1 percent and back near $70 at $69.23 on an OPEC supply cut. This is a reminder that compared to the power punch oil is capable of, tariffs and low unemployment are still theoretical threats to inflation stability. A rise in tariffs as a discrete risk to the market outlook is hard to pinpoint. Tariffs are likely of course to slow imports which would point to replacement production in the domestic economy, but retaliatory tariffs would point to an offsetting slowdown in exports. This tit-for-tat balancing is perhaps being expressed in the stock market's sideways movement. The Dow is only slightly lower than it was back in March when steel and aluminum tariffs were first announced. Interest rates have been showing much more movement but their climb, especially on the short-end of the curve, has been tied to rising expectations for Federal Reserve rate hikes. On the week, the Dow lost 2.0 percent to 24,580 and moved into the negative column for the year at minus 0.6 percent. But oil was the week's big mover, up 7.1 percent and back near $70 at $69.23 on an OPEC supply cut. This is a reminder that compared to the power punch oil is capable of, tariffs and low unemployment are still theoretical threats to inflation stability.
| Markets at a Glance |
Year-End |
Week Ended |
Week Ended |
Year-To-Date |
Weekly |
|
2017 |
15-Jun-18 |
22-Jun-18 |
Change |
Change |
| DJIA |
24,719.22 |
25,090.48 |
24,580.89 |
-0.6% |
-2.0% |
| S&P 500 |
2,673.61 |
2,779.42 |
2,754.88 |
3.0% |
-0.9% |
| Nasdaq Composite |
6,903.39 |
7,746.38 |
7,692.82 |
11.4% |
-0.7% |
|
|
|
|
|
|
| Crude Oil, WTI ($/barrel) |
$60.15 |
$64.66 |
$69.23 |
15.1% |
7.1% |
| Gold (COMEX) ($/ounce) |
$1,305.50 |
$1,282.70 |
$1,272.10 |
-2.6% |
-0.8% |
|
|
|
|
|
|
| Fed Funds Target |
1.25 to 1.50% |
1.75 to 2.00% |
1.75 to 2.00% |
50 bp |
0 bp |
| 2-Year Treasury Yield |
1.89% |
2.57% |
2.55% |
66 bp |
−2 bp |
| 10-Year Treasury Yield |
2.41% |
2.92% |
2.89% |
48 bp |
−3 bp |
| Dollar Index |
92.29 |
94.79 |
94.55 |
2.4% |
-0.3% |
Early indications of factory slowing in June are beginning to appear. And what's specifically significant about the signals of price pressures is that they're appearing in force in selling prices, not just input costs. Some portion of this pressure is tied to tariffs on steel and aluminum that have already been put in place, and pointing to further pressure is the prospect of widening and rising tariffs in the months ahead. Against the backdrop of a tight labor market and high oil prices, tariffs could become an increasing risk for inflation overshoot and a rising topic for Federal Reserve policy makers.
An upgrade for the consumer was the news of the FOMC at mid-month and Friday's personal income and consumer spending report will offer the final verdict for May. Housing is close to the consumer and the week offers key indications beginning on Monday with new home sales, which have been strong, and pending sales of existing homes on Wednesday which have been weak. The search for indications on tariff and trade-war effects will be Wednesday's focus with international goods trade and durable goods orders both posted. Also posted will be jobless claims and the third estimate for first-quarter GDP, these are out on Thursday.
National Activity Index for May
Consensus Forecast: 0.37
Consensus Range: 0.30 to 0.65
After slowing at the outset of the year, the national activity index is back at its expansion best, posting 0.34 in April and 0.32 in March to indicate well above average growth. Though employment will give a boost to May, weakness in industrial production may hold the index back. Consensus for May is a further gain to 0.37.
New Home Sales for May
Consensus Forecast, Annualized Rate: 665,000
Consensus Range: 655,000 to 700,000
Beneath uneven monthly results is a solid upward trend for new home sales which are expected to accelerate very slightly in May to a 665,000 annualized rate vs 662,000 in April. Housing completions have been coming into the market which should help sales as should relative price weakness for new homes.
Dallas Fed General Activity Index for June
Consensus Forecast: 27.0
Consensus Range: 22.0 to 33.6
Dallas is among the very strongest of the regional reports with new orders and production both at 12-year highs, with capacity utilization elevated and with price readings highly elevated. Another month of unusual strength is expected for June, at a consensus 27.0 and up slightly from May for the general activity index.
Case-Shiller, 20-City Adjusted Index for April
Consensus Forecast, Month-to-Month Change: 0.5%
Consensus Range: 0.3% to 0.6%
Case-Shiller, 20-City Unadjusted Index
Consensus Forecast, Month-to-Month Change: 0.8%
Consensus Range: 0.2% to 0.8%
Case-Shiller, 20-City Unadjusted Index
Consensus Forecast, Year-on-Year Change: 6.8%
Consensus Range: 6.6% to 7.0%
Home-price appreciation has been strong but appeared to slow going into the Spring selling season. Renewed strength is the call for April's Case-Shiller data where the consensus gain for the 20-city adjusted index is a solid 0.5 percent with the unadjusted year-on-year rate seen holding at 6.8 percent. The consensus for unadjusted monthly growth, reflecting the relative strength of April compared with other months of the year, is 0.8 percent.
Consumer Confidence Index for June
Consensus Forecast: 128.1
Consensus Range: 125.8 to 130.0
Econoday's consensus, at 128.1 in May, is calling for steady strength at a high level for the June consumer confidence index. Job assessments, both current and future, have been extraordinarily strong in this report.
Richmond Fed Manufacturing Index for June
Consensus Forecast: 16
Consensus Range: 14 to 16
Gains for new orders and a build for backlogs in May point to strength for the Richmond Fed's manufacturing index in June, at a consensus 16. This report has been showing less strength than other regional reports though hints of overheating are nevertheless apparent including acceleration for input prices.
Durable Goods Orders for May
Consensus Forecast, Month-to-Month Change: -0.6%
Consensus Range: -2.4% to 1.2%
Durable Goods Orders, Ex-Transportation
Consensus Forecast: 0.4%
Consensus Range: -0.3% to 1.3%
Durable Goods Orders, Core Capital Goods (Nondefense Ex-Aircraft)
Consensus Forecast: 0.2%
Consensus Range: -0.2% to 0.5%
Another month of underlying growth is the call for durable goods orders which however, based on expectations for aircraft orders, is forecast to show a headline decline of 0.6 percent. Ex-transportation orders are expected to rise 0.4 percent in May. Strength in core capital goods orders was a major plus in the April report and a modest 0.2 percent add-on gain is the May consensus.
International Trade In Goods for May
Consensus Forecast, Month-to-Month Change: -$69.0 billion
Consensus Range: -$69.8 to -$65.0 billion
The goods deficit is expected to widen to a consensus $69.0 in May vs $67.3 billion in March (revised from an initial $68.2 billion). May's report will update progress on second-quarter net exports and offer the latest on the bilateral deficit with China.
Advance Wholesale Inventories for April
Consensus Forecast, Month-to-Month Change: 0.3%
Consensus Range: 0.0% to 0.9%
Wholesale inventories are expected to rise 0.3 percent in May after rising 0.1 percent in April. Relative to sales, wholesale inventories have been low.
Pending Home Sales Index for May
Consensus Forecast, Month-to-Month Change: 0.7%
Consensus Range: -0.5% to 2.0%
Pending home sales are expected to increase 0.7 percent in May after dropping 1.3 percent rise in April. This index has been accurately forecasting what are flat results for the existing home sales report.
Real GDP: 1st Quarter, 3rd Estimate, Annualized Rate
Consensus Forecast: 2.2%
Consensus Range: 2.0% to 2.4%
Real Consumer Spending, Annualized Rate
Consensus Forecast: 1.0%
Consensus Range: 0.7% to 1.1%
GDP Price Index
Consensus Forecast: 1.9%
Consensus Range: 1.9% to 1.9%
The third estimate for first-quarter GDP is expected to come in at a 2.2 percent annualized rate, unchanged from the second estimate. Consumer spending is also expected to come in unchanged, at a 1.0 percent rate. The GDP price index is likewise seen unchanged at 1.9 percent.
Initial Jobless Claims for June 23 week
Consensus Forecast: 220,000
Consensus Range: 219,000 to 225,000
Initial claims are expected to come in at 220,000 in the June 23 week vs 218,000 in the prior week. All readings in this report are at or near historic lows and consistent with strong demand for labor.
Personal Income for May
Consensus Forecast, Month-to-Month Change: 0.4%
Consensus Range: 0.3% to 0.5%
Consumer Spending
Consensus Forecast, Month-to-Month Change: 0.4%
Consensus Range: 0.3% to 0.5%
PCE Price Index
Consensus Forecast, Month-to-Month Change: 0.2%
Consensus Range: 0.2% to 0.3%
PCE Price Index
Consensus Forecast, Year-on-Year Change: 2.2%
Consensus Range: 2.2% to 2.3%
Core PCE Price Index
Consensus Forecast, Month-to-Month Change: 0.2%
Consensus Range: 0.2% to 0.3%
Core PCE Price Index
Consensus Forecast, Year-on-Year Change: 1.9%
Consensus Range: 1.9% to 2.0%
Personal income is seen rising a moderate to solid 0.4 percent in May while consumer spending, in what will be the second major input into second-quarter GDP, is expected to also increase 0.4 percent. The core PCE price index, which excludes both food and energy and which is the most closely watched of all inflation readings, is seen posting a modest 0.2 percent monthly rise for a year-on-year gain of 1.9 percent and very close to the Fed's target for 2 percent. The consensus for the overall price index is also 0.2 percent for a year-on-year rate of 2.2 percent.
Chicago PMI for June
Consensus Forecast: 60.1
Consensus Range: 58.6 to 63.0
Easing strength at a high level is the call for the Chicago PMI with the June consensus at 60.1 vs 62.7 in a May report that showed gains for both new orders and backlogs. This sample has had trouble filling open positions and has been reporting delivery delays and rising costs, all consistent with capacity stress.
Consumer Sentiment Index, Final June
Consensus Forecast: 99.2
Consensus Range: 98.0 to 99.5
Expected to hold near the preliminary reading, the final consumer sentiment index for June is expected to come in at 99.2. The preliminary report proved much stronger than expected and included a rise in buying plans for durables. Year-ahead inflation expectations in this report had been flat but moved higher in the last report.
|
